

Trucking industry insights are data-driven observations and intelligence that reveal patterns in fleet performance, driver behaviour, market demand, and operational efficiency. They transform raw operational data, telematics, electronic logging devices (ELDs), fuel consumption, freight rates, detention times, and safety reports, into actionable intelligence that guides route optimization, maintenance scheduling, hiring decisions, and compliance strategies.
For Canadian B2B decision-makers managing outsourced fleets or in-house transportation operations, these insights directly impact your bottom line. A fleet running without systematic data collection and analysis operates blind, reacting to breakdowns, violations, and cost overruns rather than preventing them. Real-time visibility into hours of service (HOS) compliance, vehicle health, and delivery windows helps you avoid penalties under Transport Canada regulations and provincial standards while improving customer satisfaction.
The practical challenge isn’t gathering data. Modern fleets generate terabytes of it. The real question is which metrics matter, how to collect them without overwhelming your team, and how to turn findings into decisions that reduce cost-per-kilometre, improve on-time delivery rates, and retain qualified drivers in a tight labour market.
This article defines what constitutes meaningful trucking insights in 2026, explains how fleets collect and analyze operational data, breaks down the core types of intelligence (safety, efficiency, compliance, and market), and shows you how leading Canadian carriers apply these insights to solve staffing shortages, cut fuel waste, and maintain incident-free records. You’ll see which KPIs warrant daily monitoring, which tools streamline data workflows, and how to measure ROI on analytics investments.
What Trucking Industry Insights Mean for Canadian Fleet Operators
Trucking industry insights are the collection, analysis, and practical application of operational, regulatory, and market data to make smarter decisions about fleet performance, driver staffing, safety protocols, and compliance obligations. For Canadian fleet operators, this means turning raw numbers, from telematics devices, dispatch logs, compliance audits, and market reports, into actionable intelligence that drives measurable improvements.
The scope covers several critical dimensions. Driver availability metrics reveal how quickly you can fill open positions, where recruitment bottlenecks exist, and which retention strategies work. Freight demand trends help you anticipate seasonal peaks, adjust capacity, and negotiate rates from a position of knowledge rather than guesswork. Cost-per-kilometre benchmarks expose inefficiencies in fuel consumption, routing, and vehicle utilization, showing exactly where margin leaks occur. Safety incident rates track collision frequency, violation patterns, and near-miss events, allowing you to target training and coaching where they matter most. Regulatory updates, changes to Transport Canada standards, provincial hours-of-service rules, or CBSA cross-border requirements, ensure your fleet stays compliant without last-minute scrambles.
- KPI (key performance indicator)
- A measurable value that tracks performance against a specific business objective, such as on-time delivery percentage or driver turnover rate.
- On-time delivery rate
- The percentage of shipments arriving within the agreed service window, a core metric for customer satisfaction and contract renewal.
- Cost-per-stop
- The total operating cost divided by the number of delivery or pickup stops, used to measure route efficiency and pricing accuracy.
- Driver retention rate
- The percentage of drivers who remain with the company over a given period, inversely related to turnover and recruitment costs.
- HOS (hours of service)
- Federal and provincial regulations governing how long drivers can operate before mandatory rest breaks, critical for compliance and fatigue management.
- Incident rate
- The frequency of safety events, collisions, violations, or near misses, typically expressed per million kilometres driven.
Together, these data points form a complete picture of fleet health. A retail chain evaluating a dedicated fleet partner can compare on-time percentages and incident rates across bidders. A warehousing operation can use throughput and shift-completion data to adjust staffing levels before a volume surge. A contract driver agency can track time-to-fill and training completion rates to improve placement speed and quality. The insights themselves hold no value unless they inform real decisions: adjusting routes, revising training programs, reallocating equipment, or renegotiating contracts based on evidence rather than intuition.
How Trucking Industry Insights Work in Practice

Generating actionable intelligence in Canadian trucking operations follows a structured cycle that transforms raw data into measurable improvements in fleet performance, driver safety, and compliance. Understanding this workflow helps fleet managers and staffing providers move beyond guesswork to evidence-based decision-making that directly addresses their operational pain points.
The process starts with comprehensive data collection from multiple sources. Electronic logging devices and telematics platforms capture real-time information on driver hours, vehicle location, speed, idle time, and fuel consumption. Dispatch systems record load assignments, delivery windows, customer destinations, and actual versus scheduled completion times. Driver logs, whether digital or paper under Transport Canada HOS rules document daily driving hours, rest breaks, and off-duty periods. Compliance audits contribute data on violation trends, equipment inspections, and training completion rates. Human resources systems track driver turnover, time-to-fill for open positions, and retention by route or customer account.
Once collected, this information requires aggregation and benchmarking. Fleet operators compare their performance against industry standards, such as the national average on-time delivery rate of 92 to 95 percent, or the typical driver retention rate of 65 to 75 percent for dedicated contract fleets. Provincial benchmarks matter, too: a Greater Toronto Area fleet faces different congestion and dwell-time patterns than a regional hauler serving rural Alberta. Peer-to-peer comparisons, often facilitated by industry associations or third-party logistics platforms, reveal where a fleet stands on cost-per-kilometre, fuel efficiency, or incident rates per million kilometres driven.
Analysis focuses on identifying trends and root causes rather than isolated incidents. A spike in late deliveries might correlate with increased warehouse dwell times at a specific customer site, suggesting a need to renegotiate loading protocols. Rising fuel costs per route could point to inefficient dispatching or the need for driver coaching on speed management. A pattern of HOS violations in one region may indicate unrealistic delivery schedules that force drivers to rush, flagging a safety and compliance risk.
From these findings, fleet managers formulate targeted action plans. Operational insights might prompt route optimization to reduce empty kilometres or shift scheduling adjustments to match peak demand periods. Staffing insights could justify hiring additional drivers ahead of seasonal volume increases or launching retention initiatives if turnover exceeds benchmarks. Safety data often drives refresher training on defensive driving, fatigue management, or cargo securement. Compliance trends inform preventive maintenance schedules or pre-audit readiness checks.
The final step is ongoing monitoring to measure the impact of these interventions. If a new training program reduces incident rates by 15 percent quarter-over-quarter, the data validates the investment. If adjusting shift start times improves on-time delivery from 88 to 94 percent, the insight proved actionable. This feedback loop ensures that insights remain current, relevant, and tied to measurable outcomes, not static reports that gather dust in a filing cabinet.
Types of Trucking Industry Insights

Operational Insights
Operational insights track how efficiently your fleet moves freight and uses resources. This category includes route optimization data, comparing planned versus actual travel times, identifying bottlenecks, and adjusting paths to cut kilometres and fuel burn. Fuel consumption metrics (litres per 100 km, idle time percentage) reveal whether drivers are coasting at optimal RPM or wasting diesel in traffic. Vehicle utilization figures show whether trucks sit empty too often or run near-capacity loads, informing decisions about fleet size and asset allocation.
Delivery performance insights measure on-time percentage, dwell time at docks, and cost-per-stop. A fleet with chronic late arrivals might discover through GPS data that warehouse queues, not driver behaviour, cause delays, prompting earlier departure windows or alternative facilities. Load planning insights help consolidate shipments to maximize payload without exceeding axle limits, reducing the number of trips and vehicle wear.
Canadian operators also monitor compliance with hours-of-service rules through electronic logging device data, ensuring drivers stay within federal and provincial drive-time limits while maintaining delivery schedules. Real-time telematics catch issues like harsh braking or speeding, enabling coaching before those habits inflate fuel costs or safety incidents. Together, these operational insights turn raw fleet data into concrete actions, reroute this lane, idle less at border crossings, rebalance loads, that directly improve margin and reliability.
Staffing and Retention Insights
Driver availability sits at the heart of staffing insights for Canadian fleets. Track how many qualified drivers are in your active pool, how many are on assignment versus available, and average time-to-fill for open positions. A healthy pipeline means you can cover surge demand without scrambling; gaps signal you need to accelerate recruitment or adjust compensation.
Turnover rate reveals retention health. Calculate it monthly, drivers who left divided by average headcount, and segment by route type, region, and tenure. If turnover spikes among drivers under six months, onboarding or early-stage support may need work. Canadian long-haul turnover often runs 30-50% annually; dedicated and regional routes typically see lower churn when home-time expectations are met.
Recruitment pipeline health tracks candidates at each stage: applications received, interviews scheduled, offers accepted, drivers who complete orientation. Bottlenecks at the interview or offer-acceptance stage suggest pay, schedule, or communication issues. Monitor time-to-hire from first contact to first shift; reducing this from eight weeks to four can prevent candidates from accepting competing offers.
Training effectiveness measures completion rates for onboarding, safety refreshers, and compliance modules. Tie training data to incident rates and retention: drivers who finish structured programs often stay longer and perform more safely. Use telematics and supervisor feedback to identify skill gaps early, then tailor coaching before problems escalate.
Safety and Compliance Insights
Safety and compliance insights track incident history, violation patterns, and regulatory readiness to prevent fines and reduce risk. Canadian fleet operators monitor collision rates per million kilometres, roadside inspection outcomes, and HOS violations under provincial rules, Ontario, for example, enforces strict daily and weekly driving limits that differ from federal Transport Canada guidelines. Tracking these data points reveals whether drivers need refresher training, vehicles require more frequent inspections, or dispatch practices encourage unsafe shortcuts.
Audit readiness insights flag missing documentation, expired certifications, or overdue vehicle inspections before Transport Canada or provincial enforcement reviews occur. Preventive maintenance schedules informed by telematics data, brake wear, engine diagnostics, tire pressure, reduce breakdowns and CSA BASIC scores. When a fleet sees a spike in log-book errors or hard-braking events, targeted coaching sessions or route adjustments follow immediately. This proactive approach keeps fleets compliant, drivers safer, and insurance premiums lower.
Market and Demand Insights
Market and demand insights track freight volumes, seasonal peaks, and prevailing rates across Canadian corridors. Fleet operators use these patterns to forecast capacity needs, adding contract drivers ahead of harvest season or scaling back equipment during typical January slowdowns. Rate benchmarks help you price competitively while protecting margin: if westbound dry-van rates climb 12% above your contract floor, it signals an opportunity to renegotiate or shift resources. Monitoring provincial demand (Ontario-Quebec high-frequency lanes versus sporadic prairie shipments) guides where to station drivers and equipment. Seasonal data, December e-commerce surges, spring construction material spikes, lets you staff proactively rather than scramble for available drivers when demand peaks. Integrating market insights with your operational data ensures you match fleet size and driver schedules to real revenue opportunities, minimizing empty miles and idle assets.
How Canadian Companies Use Trucking Industry Insights
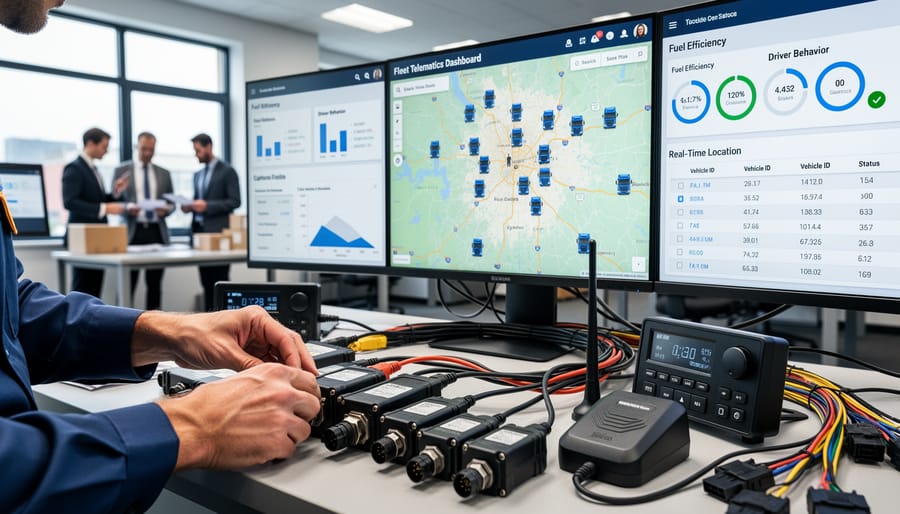
Retail chains moving palletized freight across Ontario and Quebec increasingly rely on operational data to determine the precise number of trucks and drivers they need each quarter. By analyzing delivery volumes, seasonal peaks, and route density, these firms avoid both costly overcapacity during slow periods and service failures when demand surges. A mid-sized CPG distributor serving Metro Vancouver, for instance, tracked pallet throughput and average dwell time at each warehouse dock, then adjusted its dedicated fleet size and driver shift patterns to match actual demand. The result: a 12% reduction in idle equipment hours and faster turnaround at receiving points, all without adding headcount.
Warehousing operators apply similar logic to shift scheduling. Instead of fixed staffing rosters, distribution centres in the Greater Toronto Area now monitor inbound and outbound throughput by hour and day of week, identifying bottlenecks and lulls. When telematics and dispatch records reveal that inbound deliveries concentrate between 06:00 and 10:00, warehouse managers stagger driver arrival windows and adjust forklift operator shifts accordingly. This data-driven approach smooths workflow, reduces driver wait times, and cuts overtime costs, often by 10 to 15%, while maintaining service levels.
Contract driver agencies leverage retention and placement metrics to improve both speed and quality of hire. By tracking time-to-fill, first-assignment completion rate, and 90-day turnover, agencies pinpoint which recruiting channels yield drivers who stay longest and perform best. One Alberta-based provider analyzed its onboarding data and discovered that drivers who completed an additional half-day of route familiarization had a 20% lower early-turnover rate. Acting on that insight, the agency made route orientation mandatory, shortening the ramp-up period and reducing costly re-staffing cycles.
Fleet managers targeting cost and safety improvements turn to incident and training data. When one Eastern Canada fleet noticed a cluster of backing incidents at urban delivery sites, it cross-referenced driver training records and site layouts. The insight: newer drivers operating at tight urban docks accounted for most events. The fleet responded with a focused refresher module on low-speed manoeuvring and added spotter support at high-risk locations. Within six months, backing incidents dropped by 30%, and the corresponding insurance and repair costs fell in step. These anonymized patterns mirror findings documented in Industry Insights: Canadian Trucking Staffing Case Studies where targeted interventions, guided by operational data, consistently deliver measurable gains in safety, efficiency, and driver satisfaction.
Key Metrics to Track in Canadian Trucking Operations
Canadian fleet operators typically monitor seven core metrics to translate trucking industry insights into measurable performance gains. Each KPI reveals a specific dimension of operational health, from driver retention to fuel economy, and together they form a balanced scorecard for decision-making.
On-Time Delivery Percentage measures the proportion of loads delivered within the agreed time window. Most dedicated fleets aim for 95% or higher; values below 90% signal route planning issues, driver shortages, or inadequate buffer time for Canadian border crossings and weather delays. Track this weekly and investigate recurring late deliveries by lane or shift.
Incident Rate per Million Kilometres captures preventable accidents, cargo damage, and traffic violations relative to total distance driven. High-performing Canadian carriers maintain rates below 2.0 incidents per million km; rates above 3.5 warrant immediate safety interventions such as refresher training or telematics review. Calculate this quarterly to identify patterns without reacting to one-off events.
Driver Retention Rate indicates the percentage of drivers who remain with your operation over a 12-month period. Canadian fleets average 70-80% annual retention; rates below 65% increase recruitment costs and disrupt service consistency. Segment this metric by route type, shift, and driver experience to pinpoint retention weak spots.
Cost-per-Stop divides total delivery expenses (fuel, labour, vehicle maintenance) by the number of completed drops. Retail and CPG distribution typically ranges from $15 to $35 per stop depending on urban density and delivery complexity. Rising cost-per-stop may reveal inefficient routing, excessive dwell time, or staffing mismatches.
Time-to-Fill Open Driver Positions tracks calendar days from job posting to onboarding. Most Canadian staffing agencies and contract fleets target 14-21 days; intervals beyond 30 days indicate sourcing challenges or uncompetitive compensation. Monitor this monthly to adjust recruitment tactics and partnerships.
Fuel Efficiency (litres per 100 km) benchmarks vehicle performance and driver behaviour. Long-haul tractors typically consume 28-35 litres per 100 km; local delivery trucks run 18-25 litres. Deviations above these ranges often reflect excessive idling, aggressive driving, or maintenance neglect.
Compliance Audit Score summarizes your adherence to Transport Canada standards, provincial hours-of-service rules, and vehicle inspection requirements. Scores below 85% raise red flags during roadside inspections and carrier safety ratings. Conduct internal audits quarterly and remediate violations immediately.
Common Questions About Trucking Industry Insights
Where should Canadian fleet operators source reliable trucking industry insights?
Combine internal data from telematics, dispatch systems, and driver logs with external benchmarks from industry associations, Transport Canada reports, and provincial trucking councils. This blend of proprietary and sector-wide data gives you both operational specifics and competitive context.
How often should a fleet review its performance insights?
Check real-time safety and compliance alerts daily, review operational KPIs weekly, and conduct a comprehensive analysis of trends, staffing, and cost metrics monthly. Quarterly deep-dives help you spot seasonal patterns and adjust long-term strategy.
Which KPIs matter most for small fleets versus large operators?
Small fleets should prioritize driver retention rate, on-time delivery percentage, and cost-per-kilometre to maximize efficiency with limited resources. Large operators benefit from tracking those same metrics plus capacity utilization, incident rate per million kilometres, and time-to-fill driver vacancies across regions.
How do I protect driver privacy when collecting telematics data?
Under PIPEDA, you must obtain informed consent, collect only what’s necessary for legitimate business purposes, secure the data, and allow drivers to access their own records. Anonymize individual driver data when sharing benchmarks externally and establish clear policies on how long you retain information.
Translating these trucking industry insights into staffing decisions is straightforward once you know what to watch. High driver turnover or extended time-to-fill metrics signal recruitment process gaps or compensation mismatches; respond by adjusting onboarding speed, training support, or pay structures. Incident rate spikes in a particular route or shift point to targeted safety coaching needs, not blanket retraining. If capacity utilization dips below benchmarks, you may be over-staffed for current freight volumes, or you might discover underutilized drivers who could shift to higher-demand lanes. The key is acting on patterns, not isolated data points, and looping drivers into the conversation when insights affect schedules, equipment, or safety protocols.
Trucking industry insights transform raw operational data into decisions that strengthen Canadian fleets. When you track the right metrics, on-time delivery percentages, incident rates, driver retention figures, and cost-per-kilometre benchmarks, you gain the clarity needed to cut waste, reduce safety incidents, and keep skilled drivers on your team. The difference between guessing and knowing shows up in your bottom line and in the stability of your operations.
Fleet operators and staffing providers who commit to regular data review and act on what they find consistently outperform competitors who rely on intuition alone. Insights reveal where routes can be optimized, which training programs actually improve safety scores, and when seasonal demand requires additional drivers. These aren’t abstract benefits. They’re measurable improvements in efficiency, compliance, and workforce stability that compound over time.
If you’re ready to see how data-driven fleet management works in practice, IceCorp’s case studies demonstrate real applications across retail, CPG, and warehousing sectors. Each example shows how targeted insights led to specific operational gains, fewer incidents, lower turnover, better service levels. Explore the case studies to identify strategies that fit your operation, or contact the IceCorp team directly to discuss how staffing and fleet management consultation can support your goals.